

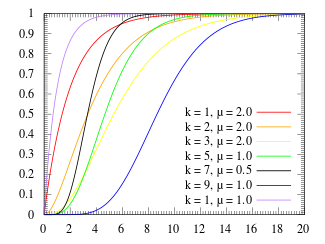
Erlang distribution
The Erlang distribution is a two parameter family of continuous probability distributions with support . The two parameters are:

- a positive integer 'shape'
- a positive real 'rate' ; sometimes the scale , the inverse of the rate is used.


The Erlang distribution with shape parameter equal to 1 simplifies to the exponential distribution. It is a special case of the Gamma distribution. It is the distribution of a sum of independent exponential variables with mean 1/ λ each.
The Erlang distribution was developed by A. K. Erlang to examine the number of telephone calls which might be made at the same time to the operators of the switching stations. T
Events that occur independently with some average rate are modeled with a Poisson process.
The waiting times between k occurrences of the event are Erlang distributed.
The Erlang distribution, which measures the time between incoming calls, can be used in conjunction with the expected duration of incoming calls to produce information about the traffic load measured in erlangs.
The number of events in a given amount of time is described by the Poisson distribution.

Poisson distribution
Poisson分佈適合於描述單位時間內隨機事件發生的次數的機率分佈。如某一服務設施在一定時間內受到的服務請求的次數,電話交換機接到呼叫的次數、汽車站台的候客人數、機器出現的故障數、自然災害發生的次數、DNA序列的變異數、放射性原子核的衰變數、雷射的光子數分佈等等。
An event can occur 0, 1, 2, … times in an interval. The average number of events in an interval is designated (lambda). Lambda is the event rate, also called the rate parameter. The probability of observing k events in an interval is given by the equation
probability mass function (PMF) for a Poisson distribution.

where
- is the average number of events per interval
- e is the number 2.71828... (Euler's number) the base of the natural logarithms
- k takes values 0, 1, 2, ….
Poisson分佈的參數λ是單位時間(或單位面積)內隨機事件的平均發生次數。
期望值 決定常態分配的曲線外觀
期望值 決定常態分配的曲線外觀
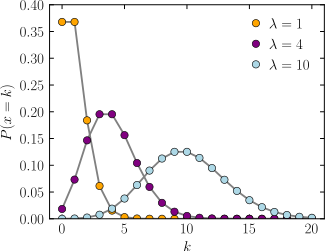
=1, 0*0.37+1*0.37+2*0.19+3*0.07+5*0.000+6*0.0000=~1
=10, 平均值在中間 (0~20) 為一個常態分配
Examples of probability for Poisson distributions[edit]
On a particular river, overflow floods occur once every 100 years on average. Calculate the probability of k = 0, 1, 2, 3, 4, 5, or 6 overflow floods in a 100-year interval, assuming the Poisson model is appropriate.
Because the average event rate is one overflow flood per 100 years, λ = 1


參考:
Pareto distribution
Consider a population of households and suppose sampling household incomes is like sampling from a
Pareto[10000,2].
What proportion of people earn more than $100000? From the form of the survival function, it should be
obvious that the answer is 1%: only 1 in 100 households earn more than $100000.
f X is a random variable with a Pareto (Type I) distribution,[1] then the probability that X is greater than some number x, i.e. the survival function (also called tail function), is given by


Exponential distribution
- In probability theory and statistics, the exponential distribution (a.k.a. negative exponential distribution) is the probability distribution that describes the time between events in a Poisson process, i.e. a process in which events occur continuously and independently at a constant average rate.
- It is a particular case of the gamma distribution. It is the continuous analogue of the geometric distribution, and it has the key property of being memoryless. In addition to being used for the analysis of Poisson processes, it is found in various other contexts.
沒有留言 :
張貼留言